Conducting online linguistic research with R Shiny

A quick blog post about my experiences using R Shiny and Google Sheets (free) to conduct online linguistic research.
Back in 2021, I taught a course on ‘Doing Linguistic Research with R’. As part of the course the students had to conduct their own linguistic research and analyse the results in R, and I figured out a way that they could use R Shiny to design simple linguistic surveys and collect linguistic data from online participants.
Shiny is primarily used for displaying data interactively. See for example my Shiny app on Ideophones in Japan. However, I’ve discovered that you can also use it for running experiments. It’s easier than Javascript, and cheaper + more customisable than paying for a service like Qualtrics or Gorilla (though I would still use Gorilla if you want to do more complicated things).
| Survey software (e.g. Qualtrics) | Javascript/HTML/PHP | Shiny | |
|---|---|---|---|
| Cost | $$$ | Low | Low/Free* |
| Learning curve | Low | High | Medium |
| Customisation | Low | High | High |
| Data and stats integration | Low | Low | High |
*shinyapps.io provides free hosting for up to 5 apps, with up to 25 active hours per month. After that you have to pay a monthly fee to increase the number of apps/active hours per month (the cheapest option is $9/month for 25 apps and 100 active hours)
Pretty much everything you can do with javascript, you can do with shiny, but it has the added advantage of being easier to learn and write (since it’s built on R, which most researchers already know). Also, since you’re likely to use R for data analysis, it’s good to have the data already in a format that R can work with. Running your experiments in RShiny thus simplifies your workflow from data collection > analysis.
The experiment we made in class was very simple. We were comparing Swedish and English terms for different types of baked goods, to see how the semantics can differ even between words belonging to the same cognate set. Below is an example of the English version of the survey:
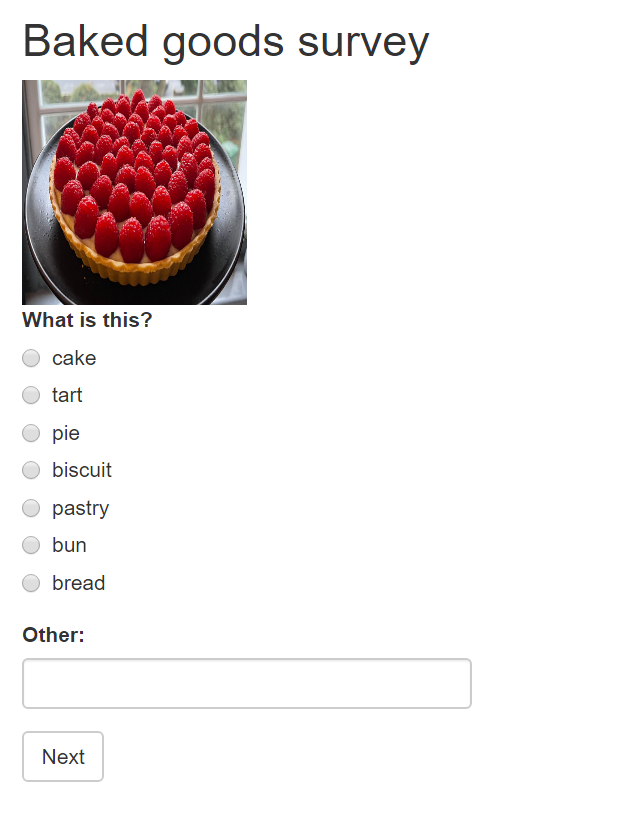
Participants click through the images and choose a label for each type of baked good (or provide their own using the text box).
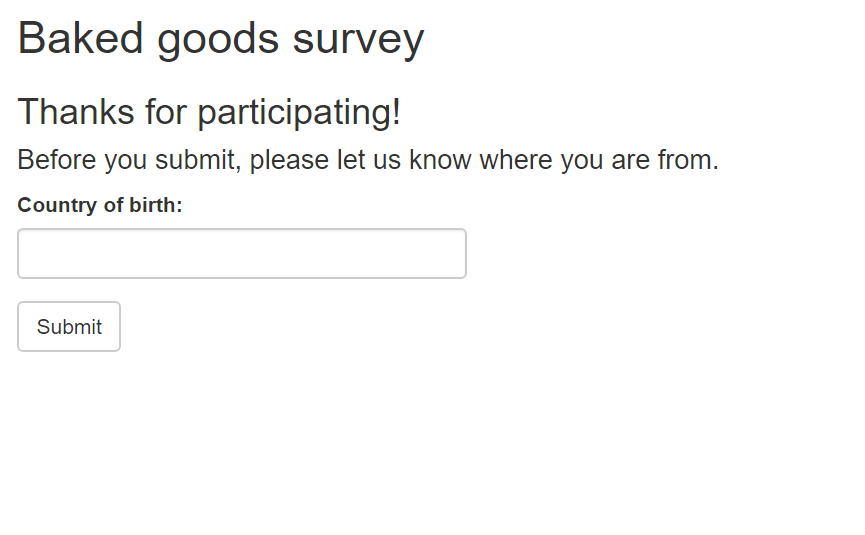
At the end they get a message thanking them for their participation, along with a question about where they’re from. Their answers are then written to google sheets (you have to give Shiny permission to write to your google drive for it to work).
Shiny can handle all kinds of input, from radio buttons, sliders, and drop down menus to free text and even drawing.
I’ve shared the code for the experiment above on Github here, along with code for similar experiments with audio files and videos. Enjoy!